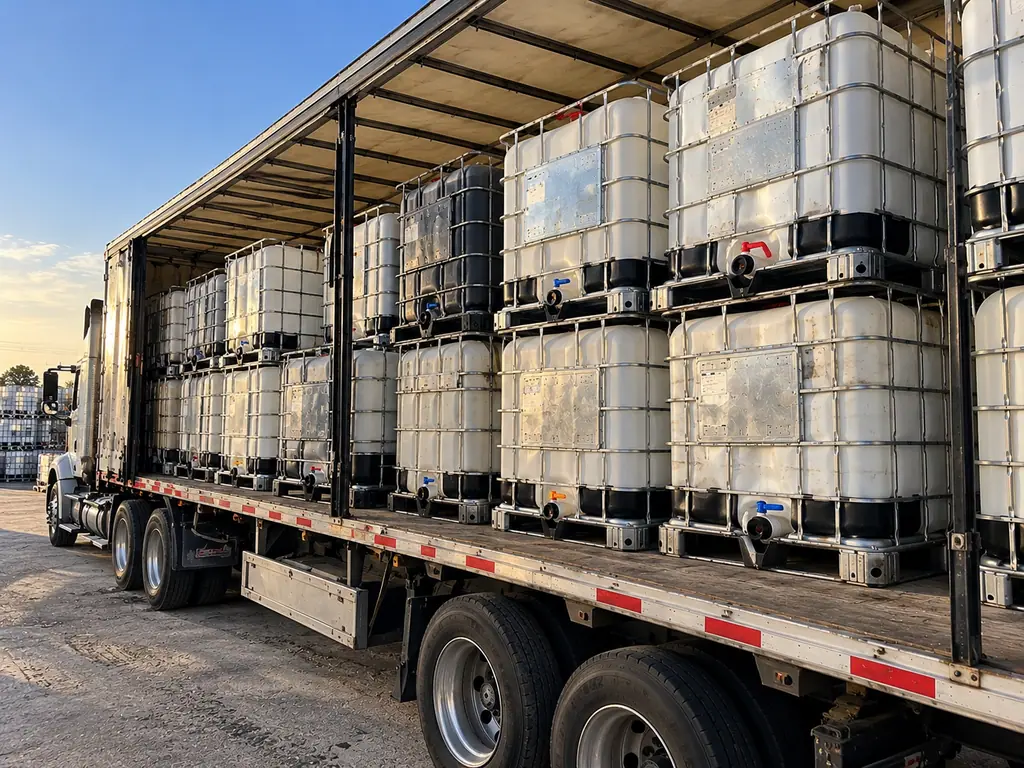
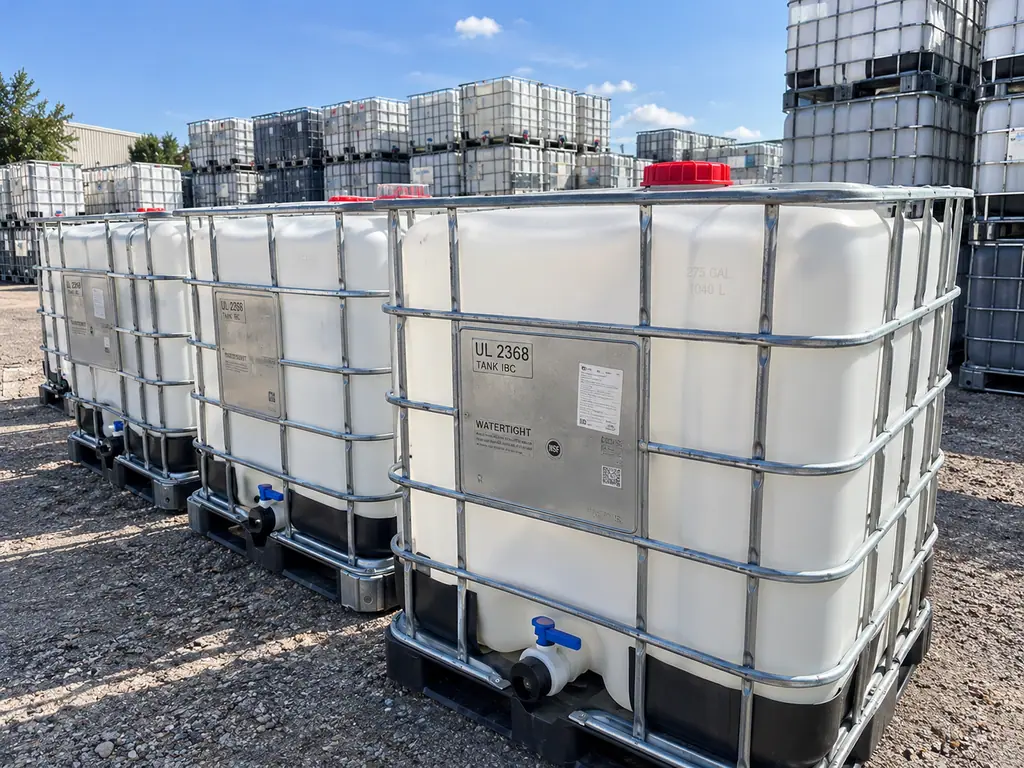
We started photographing every arriving unit from six angles in 2016, originally to settle disputes. The dispute benefit was immediate. The analytical benefit took years to show up.
Pattern 1 · Damage is regional
Units from road-salt states carry foot rust at roughly twice the rate of units from the same era elsewhere, and the rust is concentrated on the side that faced a dock door. Salt-laden slush gets tracked into buildings and sits where the feet are.
We now expect it, check for it first on Michigan and Ohio intake, and price accordingly rather than being surprised.
Pattern 2 · Fleets damage identically
When a load of twenty arrives from one site, the damage is almost never random. Same bowed tube, same side, same height. That is one forklift and one habit, repeated for years.
It also means a single conversation with that customer can change the condition of their entire next load, which is the most useful thing the archive has produced commercially.
Pattern 3 · Bottles fail by orientation
On units stored outdoors in a fixed position, the sun-facing wall is measurably more degraded than the other three. Obvious in hindsight; invisible without hundreds of comparable images.
The practical consequence is that rotating outdoor totes twice a year genuinely extends their life, which is advice we would not have believed before seeing the photographs side by side.
Pattern 4 · Cages outlive bottles about two to one
Across the archive, the mean number of bottles fitted per cage is 1.9. That single number is the empirical basis for our entire rebottling programme — we were separating the two components on instinct before we could show it was right.
| What the archive shows | Figure |
|---|---|
| Mean bottles per cage | 1.9 |
| Mean service loops per cage | 5.8 |
| Median cage service life | 11 years |
| Longest-serving cage on record | 19 years, four bottles |
| Share of damage attributable to handling | roughly half |
| Share of bottles scrapped for UV rather than chemistry | about a third |
What we would do differently
Photograph the interior from the start. We added the lit interior shot in 2019 and we would give a lot to have the first three years. And record the base type in the file from day one — we backfilled it and the early data is softer as a result.
What it means for a buyer
When we quote you a grade, there is an image set behind it and a history behind that. You can ask for both. Most customers ask once, see that they exist, and never ask again — which is roughly the point of having them.